Statistics is a fascinating branch of mathematics that helps us understand and interpret data in a structured way. Among the foundational concepts in this field are the mean, mode, median, and range.
These measures are not just theoretical but find practical applications in various domains, including education, business, and daily life.
This article will delve deep into these concepts, with insights inspired by resources like mean mode median and range corbettmaths, offering clear explanations and examples.
Understanding the Mean
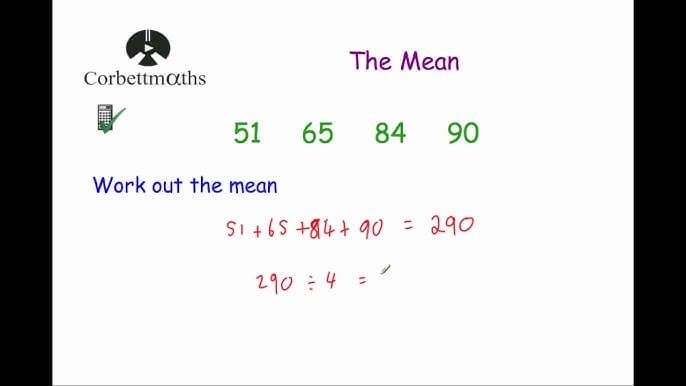
The mean, often referred to as the average, is a measure that gives us a central value for a data set. It is calculated by summing all the data points and dividing by the number of points.
Formula for the Mean:
Mean = (Sum of all data values) / (Number of data values)
Example: Consider the data set: 10, 20, 30, 40, 50. The sum is 150, and the number of data points is 5. Thus, the mean is 150 / 5 = 30.
The mean is particularly useful when the data points are evenly distributed, offering a clear central value. However, it can be influenced by extreme values (outliers), which can distort its representation.
Exploring the Median
The median is the middle value in an ordered data set. To find the median, arrange the data in ascending order and identify the central value. If the number of data points is even, the median is the average of the two middle numbers.
Example: Data set: 5, 15, 25, 35, 45 The median is 25, as it is the third value in the ordered set.
For an even number of data points: Data set: 10, 20, 30, 40 The median = (20 + 30) / 2 = 25.
Unlike the mean, the median is not affected by extreme values, making it a more robust measure of central tendency for skewed distributions.
The Mode: Most Frequent Value
The mode represents the most frequently occurring value in a data set. A data set can have one mode (unimodal), more than one mode (bimodal or multimodal), or no mode at all if no number repeats.
Example: Data set: 3, 3, 6, 9, 12 The mode is 3, as it appears more frequently than any other value.
The mode is particularly useful in categorical data analysis, where identifying the most common category or value is essential.
Understanding the Range
The range measures the spread of a data set and is calculated by subtracting the smallest value from the largest.
Formula for the Range:
Range = Maximum value – Minimum value
Example: Data set: 8, 12, 16, 20, 24 Range = 24 – 8 = 16
While the range provides a quick sense of variability, it relies only on the extreme values and does not account for the distribution of other data points.
Applications of Mean, Mode, Median, and Range

The concepts of mean, mode, median, and range corbettmaths highlight their significance in real-world scenarios:
- Education: Teachers analyze student performance using the mean to determine the class average, the median to assess mid-level performance, and the mode to identify the most common scores.
- Business: Companies use these measures to evaluate sales data, determine average expenses, and understand trends in customer preferences.
- Healthcare: Medical professionals analyze patient data, such as average blood pressure or most common symptoms, to inform treatment plans.
Strengths and Limitations
Each of these statistical tools has its strengths and weaknesses:
- Mean: Provides a comprehensive central value but is sensitive to outliers.
- Median: Robust to extreme values but does not utilize all data points.
- Mode: Useful for identifying common values but may not exist or be unique in some data sets.
- Range: Simple to calculate but only considers the extremes.
Summary
The concepts of mean, mode, median, and range are indispensable for understanding data. Resources like mean mode median and range corbettmaths provide valuable guidance in mastering these foundational tools.
Whether you are a student, professional, or data enthusiast, a solid grasp of these measures will enhance your analytical skills. By integrating these tools thoughtfully, you can unlock deeper insights and make informed decisions based on data.